

When Markets Fall: Rehearsing 20%, 30% and 50%
A falling market is the biggest test of any plan. This lesson covers the arithmetic of recovery, what different allocations actually lose, real historical declines, and a written 'downturn plan' to fill in before you need it.
- Published
- 2026-11-10
- Last verified
- 2026-11-10
- Recheck by
- 2027-01-20
- Reading time
- 10 min read
- Revision
- rev.1
- Editorial approval
- Approved 2026-11-10
Co-authored and managed by John Park and his team of AI agents, orchestrated by AXE.
TL;DR A large decline is a question of when, not if. Since 2000 alone, the US S&P 500 has fallen 40% to 55% more than once. After a 50% fall, you need a 100% gain to get back to even. In a simplified 80% stock, 20% bond portfolio where only stocks fall 50%, $50,000 becomes $30,000. The goal of this lesson is to look at those numbers while markets are calm, and write down what you will and will not do. Past recoveries do not guarantee future ones.
When choosing an allocation in Lesson 5, we asked whether you could get through a realistic worst year without changing course. This lesson turns that question into numbers. Understanding a downturn in your head and living through one in your own account are very different experiences, which is why deciding in advance, while things are calm, is the strongest preparation there is.
1. Names for the size of a fall
| Decline from peak | Common name | How it feels |
|---|---|---|
| About 10% | Correction | The news gets louder |
| About 20% | Bear market | "Should I sell before it gets worse?" |
| 30% or more | Deep bear market | You hear of people quitting investing |
| Around 50% | Historic crash | Only a minority stick to their plans |
2. The arithmetic of recovery
Losses and gains are not symmetrical. A 50% fall followed by a 50% rise leaves you at 75% of where you started.
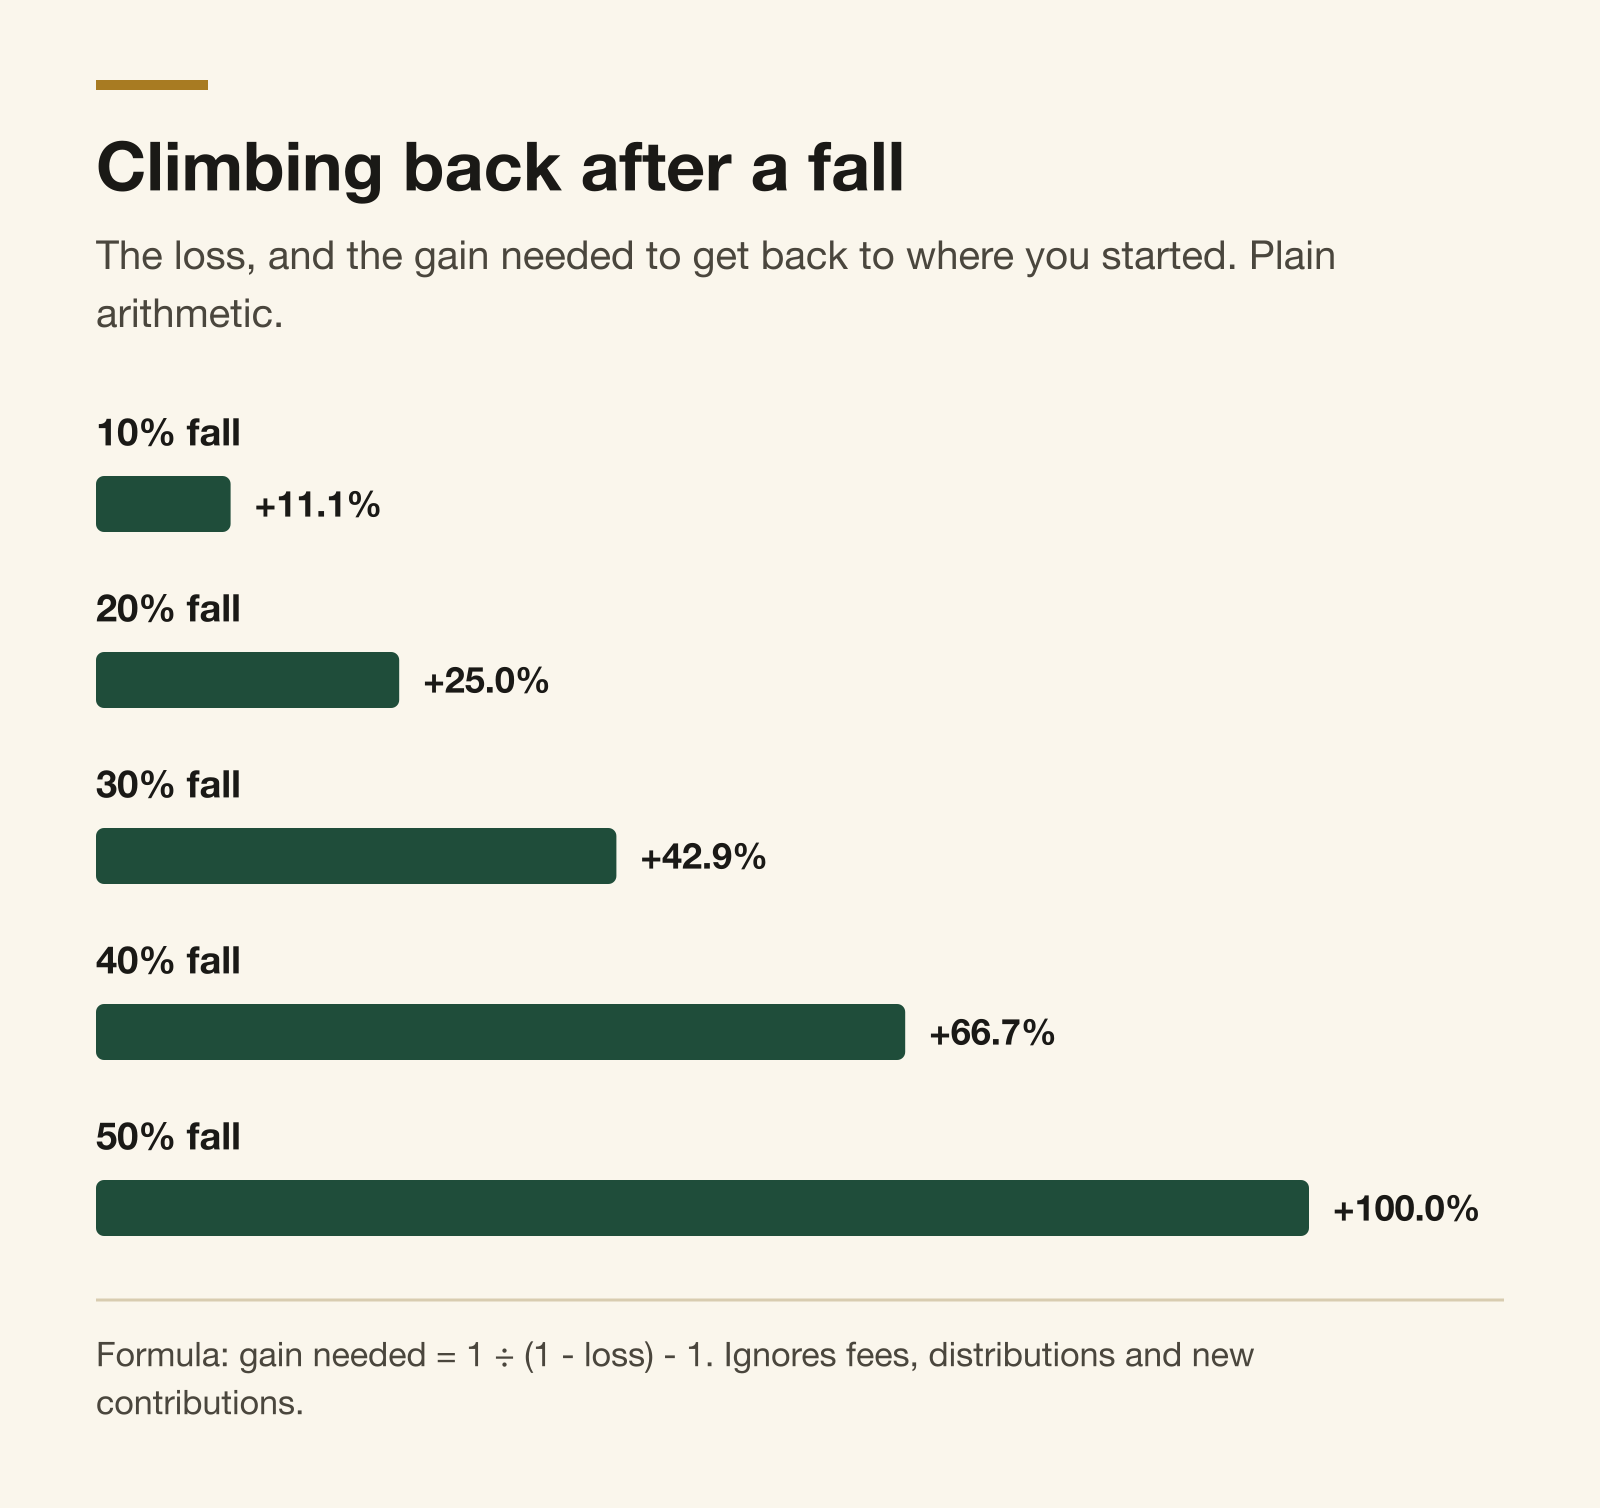 Climbing back after a fall. The loss, and the gain needed to get back to where you started. Plain arithmetic.
Figure 1. The gain needed to recover from each size of loss. Plain arithmetic, ignoring fees, distributions and new contributions.
Formula: gain needed = 1 ÷ (1 - loss) - 1
This tells you two things. First, recovering from a large decline can take time. Second, money you keep contributing during the decline buys at lower prices, so it has a shorter distance to climb than the portfolio as a whole. This is exactly when the automatic plan from Lesson 7 does its work.
3. What would it mean for your portfolio?
Dollar amounts shake people more than percentages. Below is a simplified $50,000 portfolio where only the stock portion falls and bonds stay flat.
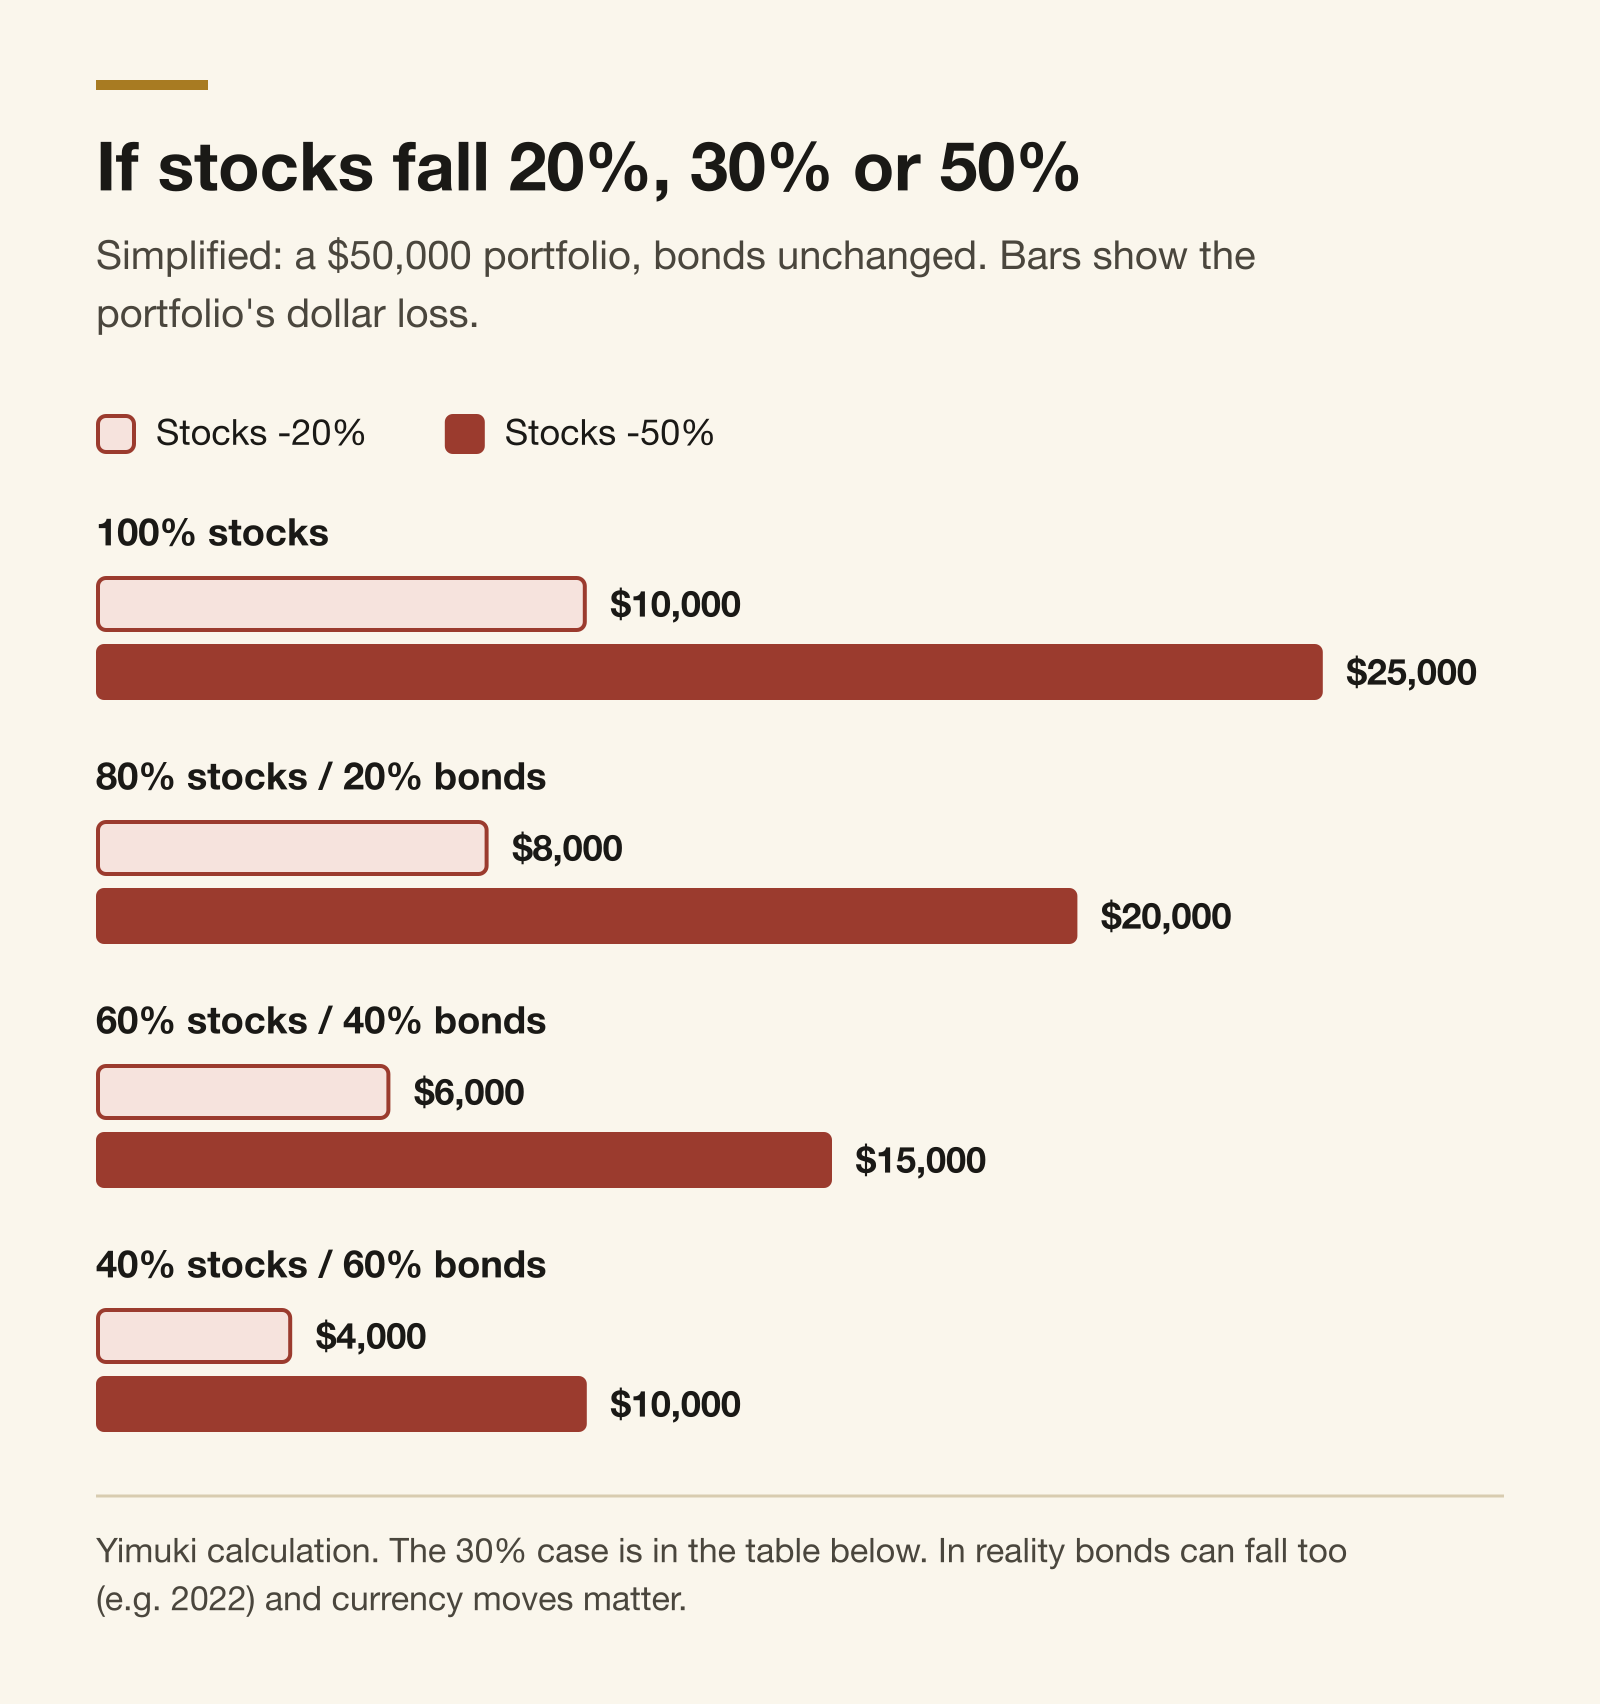 If stocks fall 20%, 30% or 50%. Simplified: a $50,000 portfolio, bonds unchanged. Bars show the portfolio's dollar loss.
Figure 2. Hypothetical dollar loss by allocation when stocks fall 20%, 30% or 50%. Simplified example with bonds unchanged.
Source: Yimuki calculation Assumptions: $50,000 portfolio, only the stock portion falls, bonds unchanged, no currency moves, distributions or fees Verified: 2026-10-22
| Allocation (stocks/bonds) | Stocks -20% | Stocks -30% | Stocks -50% |
|---|---|---|---|
| 100 / 0 | -$10,000 (-20%) | -$15,000 (-30%) | -$25,000 (-50%) |
| 80 / 20 | -$8,000 (-16%) | -$12,000 (-24%) | -$20,000 (-40%) |
| 60 / 40 | -$6,000 (-12%) | -$9,000 (-18%) | -$15,000 (-30%) |
| 40 / 60 | -$4,000 (-8%) | -$6,000 (-12%) | -$10,000 (-20%) |
This table may be kinder than reality. In a year like 2022, when interest rates rose quickly, stocks and bonds fell together. And for US assets, converting back to Canadian dollars can make a loss bigger or smaller. Look at the number for your own allocation and ask: "Could I keep contributing while looking at an account missing this much?" If the honest answer is closer to no, revisit your allocation while markets are calm. Changing it in the middle of a downturn often locks in losses and misses the recovery.
4. Large declines that really happened
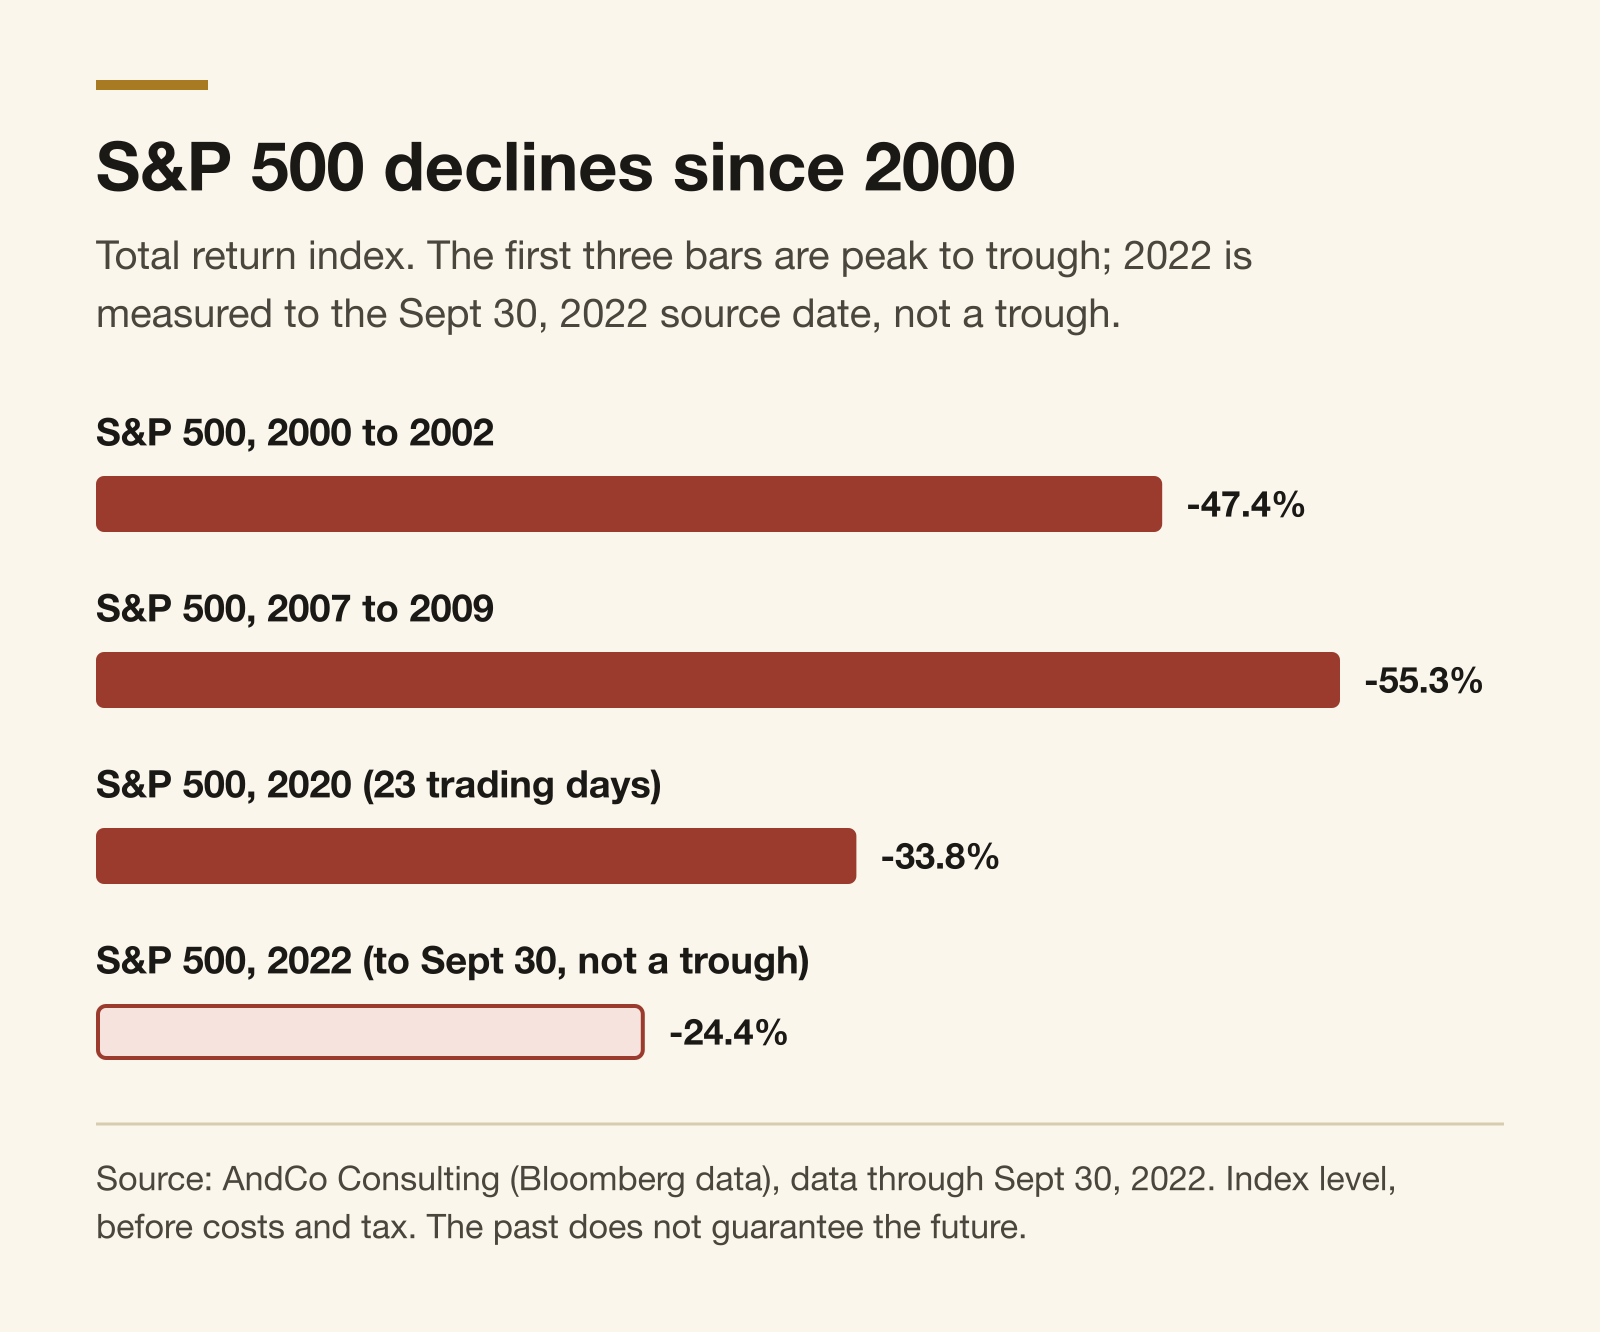 S&P 500 declines since 2000. Total return index. The first three bars are peak to trough; 2022 is measured to the Sept 30, 2022 source date, not a trough.
Figure 3. Large S&P 500 declines since 2000, total return index. The first three bars are peak-to-trough drawdowns; the 2022 bar is the decline measured through the source date of September 30, 2022, not a full-year trough.
Source: AndCo Consulting (based on Bloomberg data), data through September 30, 2022 Assumptions: S&P 500 total return, before costs and tax. The 2022 figure is measured from the peak through the source date of September 30, 2022, and is not a full-year trough. Actual investor results depend on products, costs and timing of contributions. Verified: 2026-10-22
| Period | Index | Decline from peak | Measured | Notes |
|---|---|---|---|---|
| 2000 to 2002 | S&P 500 | -47.4% | Peak to trough | Tech bubble bursts, a slide over about two years |
| 2007 to 2009 | S&P 500 | -55.3% | Peak to trough | Global financial crisis |
| Feb to Mar 2020 | S&P 500 | -33.8% | Peak to trough | COVID-19, in 23 trading days |
| Jan to Sep 2022 | S&P 500 | -24.4% | Peak to September 30, 2022 (source date), not a trough | Rapid rate increases; bonds fell too |
Readers who lived through the 1997 Asian financial crisis or 2008 in Korea will find these numbers familiar. Each decline had a different cause, speed and recovery. Some, like 2020, fell within weeks and recovered within a year; others, like the early 2000s, ground lower over several years.
5. Your downturn plan: write it now
Fill this in while markets are calm. When a downturn comes, you re-read it instead of deciding from scratch.
| Item | My answer |
|---|---|
| My allocation, and my expected loss if stocks fall 50% | e.g. 80/20, about $20,000 |
| When I need this money | e.g. in 15 years |
| How many months of expenses my emergency fund covers | e.g. 4 months |
| My base contribution during a decline | e.g. unchanged |
| If I have extra money to invest | e.g. buy more, in my target mix |
| My rebalancing rule | e.g. rebalance when off target by 5 percentage points or more |
| How often I check my account | e.g. once a month, on contribution day only |
| What would justify changing the plan | e.g. life changes such as job loss or a new goal date. Not headlines |
| Who I talk to when I feel shaken | e.g. my spouse, a trusted registered adviser |
What not to do in a downturn
- Borrow to "buy the bottom." If the decline continues, losses and interest grow together.
- Pile into one stock for the rebound. An index can recover while an individual company does not.
- Check your account daily or hourly. The loss aversion from Lesson 2 grows the more often you look.
- Invest your emergency fund because "it will recover soon." Nobody knows when.
What you can do in a downturn
- Keep contributing. The same dollars buy more units.
- Rebalance. If stocks have fallen well below target, sell some bonds or direct new contributions to stocks. All-in-one ETFs do this for you.
- Use losses in a non-registered account. You can sell a holding at a loss to realize it, and move into something similar but not identical. Mind the 30-day rule from Lesson 8, and talk to a tax professional if unsure.
The strongest counterargument
"The US market has always recovered, but not every market does." This is not an argument to wave away. Japan's Nikkei 225 did not close above its late-1989 peak until February 22, 2024, more than 30 years later on a price basis. "It always comes back if you wait" is a hope, not a fact.
The lesson here is not to abandon your plan in a downturn, but not to bet everything on one country or one market. That is why the asset allocation ETFs in Lesson 5 spread money across Canada, the US, other developed markets, emerging markets and bonds. An investor who kept contributing after 1989 bought each later unit below the 1989 peak, so their average cost was lower than for someone who invested everything at the top. Diversification and regular contributions do not guarantee a recovery, but they reduce the chance that one market's long slump sinks your whole plan.
Downturn readiness checklist
- I calculated my dollar loss if stocks fall 20%, 30% and 50%
- I answered honestly whether I could keep contributing after seeing it
- My emergency fund is separate, so I will not be forced to sell in a downturn
- I filled in and saved my downturn plan
- I set a rebalancing rule in numbers
- I decided how often I will check my account
- I wrote down that I will not borrow to invest
- I chose who I will talk to when I feel shaken
Next: Lesson 10 finishes the course with a threat as dangerous as any downturn, investment fraud, and the once-a-year review that keeps everything on track.
Sources
- Ontario Securities Commission / GetSmarterAboutMoney, "Time and Risk 2026" (PDF): https://www.getsmarteraboutmoney.ca/app/uploads/2026/03/TIME-AND-RISK-2026.pdf
- Ontario Securities Commission / GetSmarterAboutMoney, "What is risk tolerance in investing?": https://www.getsmarteraboutmoney.ca/learning-path/understanding-risk/what-is-risk-tolerance-in-investing/
- AndCo Consulting, "S&P 500 Drawdown and Recovery Comparison" (Washoe County deferred compensation committee materials, 2022): https://www.washoecounty.gov/humanresources/board_committees/deferred_compensation/2022/11-09-2022%20Item%2014%202022-09-30%20SP%20500%20-%20Drawdown%20and%20Recovery%20Comparison.pdf
- CIRO, "Why diversify your portfolio?": https://www.ciro.ca/office-investor/investing-basics/why-diversify-your-portfolio
- FINRA, "Market Timing": https://www.finra.org/investors/insights/market-timing
- Vanguard Investments Canada, "Best practices for behavioural coaching" (PDF): https://www.vanguard.ca/content/dam/intl/americas/canada/en/documents/gas/best-practices-behavioral-coaching.pdf
- Canada Revenue Agency, "Capital losses" (superficial loss): https://www.canada.ca/en/revenue-agency/services/tax/individuals/topics/about-your-tax-return/tax-return/completing-a-tax-return/personal-income/line-12700-capital-gains/capital-losses-deductions.html#SL
- Bloomberg, "Nikkei Overtakes 1989 High to Hit Record as Global Funds Pour In" (2024-02-22): https://www.bloomberg.com/news/articles/2024-02-22/nikkei-225-heads-to-close-above-record-high-reached-in-1989
Disclaimer: This content is provided for general informational and educational purposes only. It is not investment, financial, tax, or legal advice. Yimuki Markets is not a registered investment adviser. All investing involves risk, including possible loss of principal. Consider your circumstances and consult a qualified professional before making financial decisions.
Publication gate
BLOCKED_PUBLICATION: Requires John's exact-revision approval plus Canadian legal, tax, investment, and Korean-language review. All dated claims must be rechecked within seven days of publication.
Co-authored and managed by John Park and his team of AI agents, orchestrated by AXE.
Sources
- getsmarteraboutmoney.cahttps://www.getsmarteraboutmoney.ca/app/uploads/2026/03/TIME-AND-RISK-2026.pdf
- getsmarteraboutmoney.cahttps://www.getsmarteraboutmoney.ca/learning-path/understanding-risk/what-is-risk-tolerance-in-investing/
- washoecounty.govhttps://www.washoecounty.gov/humanresources/board_committees/deferred_compensation/2022/11-09-2022%20Item%2014%202022-09-30%20SP%20500%20-%20Drawdown%20and%20Recovery%20Comparison.pdf
- ciro.cahttps://www.ciro.ca/office-investor/investing-basics/why-diversify-your-portfolio
- finra.orghttps://www.finra.org/investors/insights/market-timing
- vanguard.cahttps://www.vanguard.ca/content/dam/intl/americas/canada/en/documents/gas/best-practices-behavioral-coaching.pdf
- canada.cahttps://www.canada.ca/en/revenue-agency/services/tax/individuals/topics/about-your-tax-return/tax-return/completing-a-tax-return/personal-income/line-12700-capital-gains/capital-losses-deductions.html#SL
- bloomberg.comhttps://www.bloomberg.com/news/articles/2024-02-22/nikkei-225-heads-to-close-above-record-high-reached-in-1989
Korean original
Read the Korean original at /articles/when-markets-fall-plan-ko →